Building a Unified Model of Software Systems
A concrete approach to representing software systems for machine reasoning.
Every complex software system has two representations.
One is the formal model: code, configurations, and documentation. The other lives in the heads of engineers who've built and operated it.
This second model is far more valuable. It captures what actually talks to what, what changed recently, and how failures really propagate.
It forms slowly through experience. No single engineer carries the full picture; the understanding is distributed across people and teams. As the system grows, that implicit model becomes harder to share and increasingly incomplete.
To build machine intelligence that reasons over large software systems, a prerequisite is making this implicit understanding explicit. Captured in a form that persists, scales, and is machine-legible.
Where We Began
The first version of Antimetal was an AI agent in a simple search-and-synthesis loop. Given an incident, it would pull observability data, infrastructure state, deployment events, and code changes, dump it into context, and attempt to generate a root cause. If the answer wasn't confident enough, it'd repeat this process until it converged or it hit a threshold.
This worked well for simple issues, but in complex environments, quality quickly degraded. Antimetal would latch on to symptoms rather than the actual root causes.
Here's a real example:
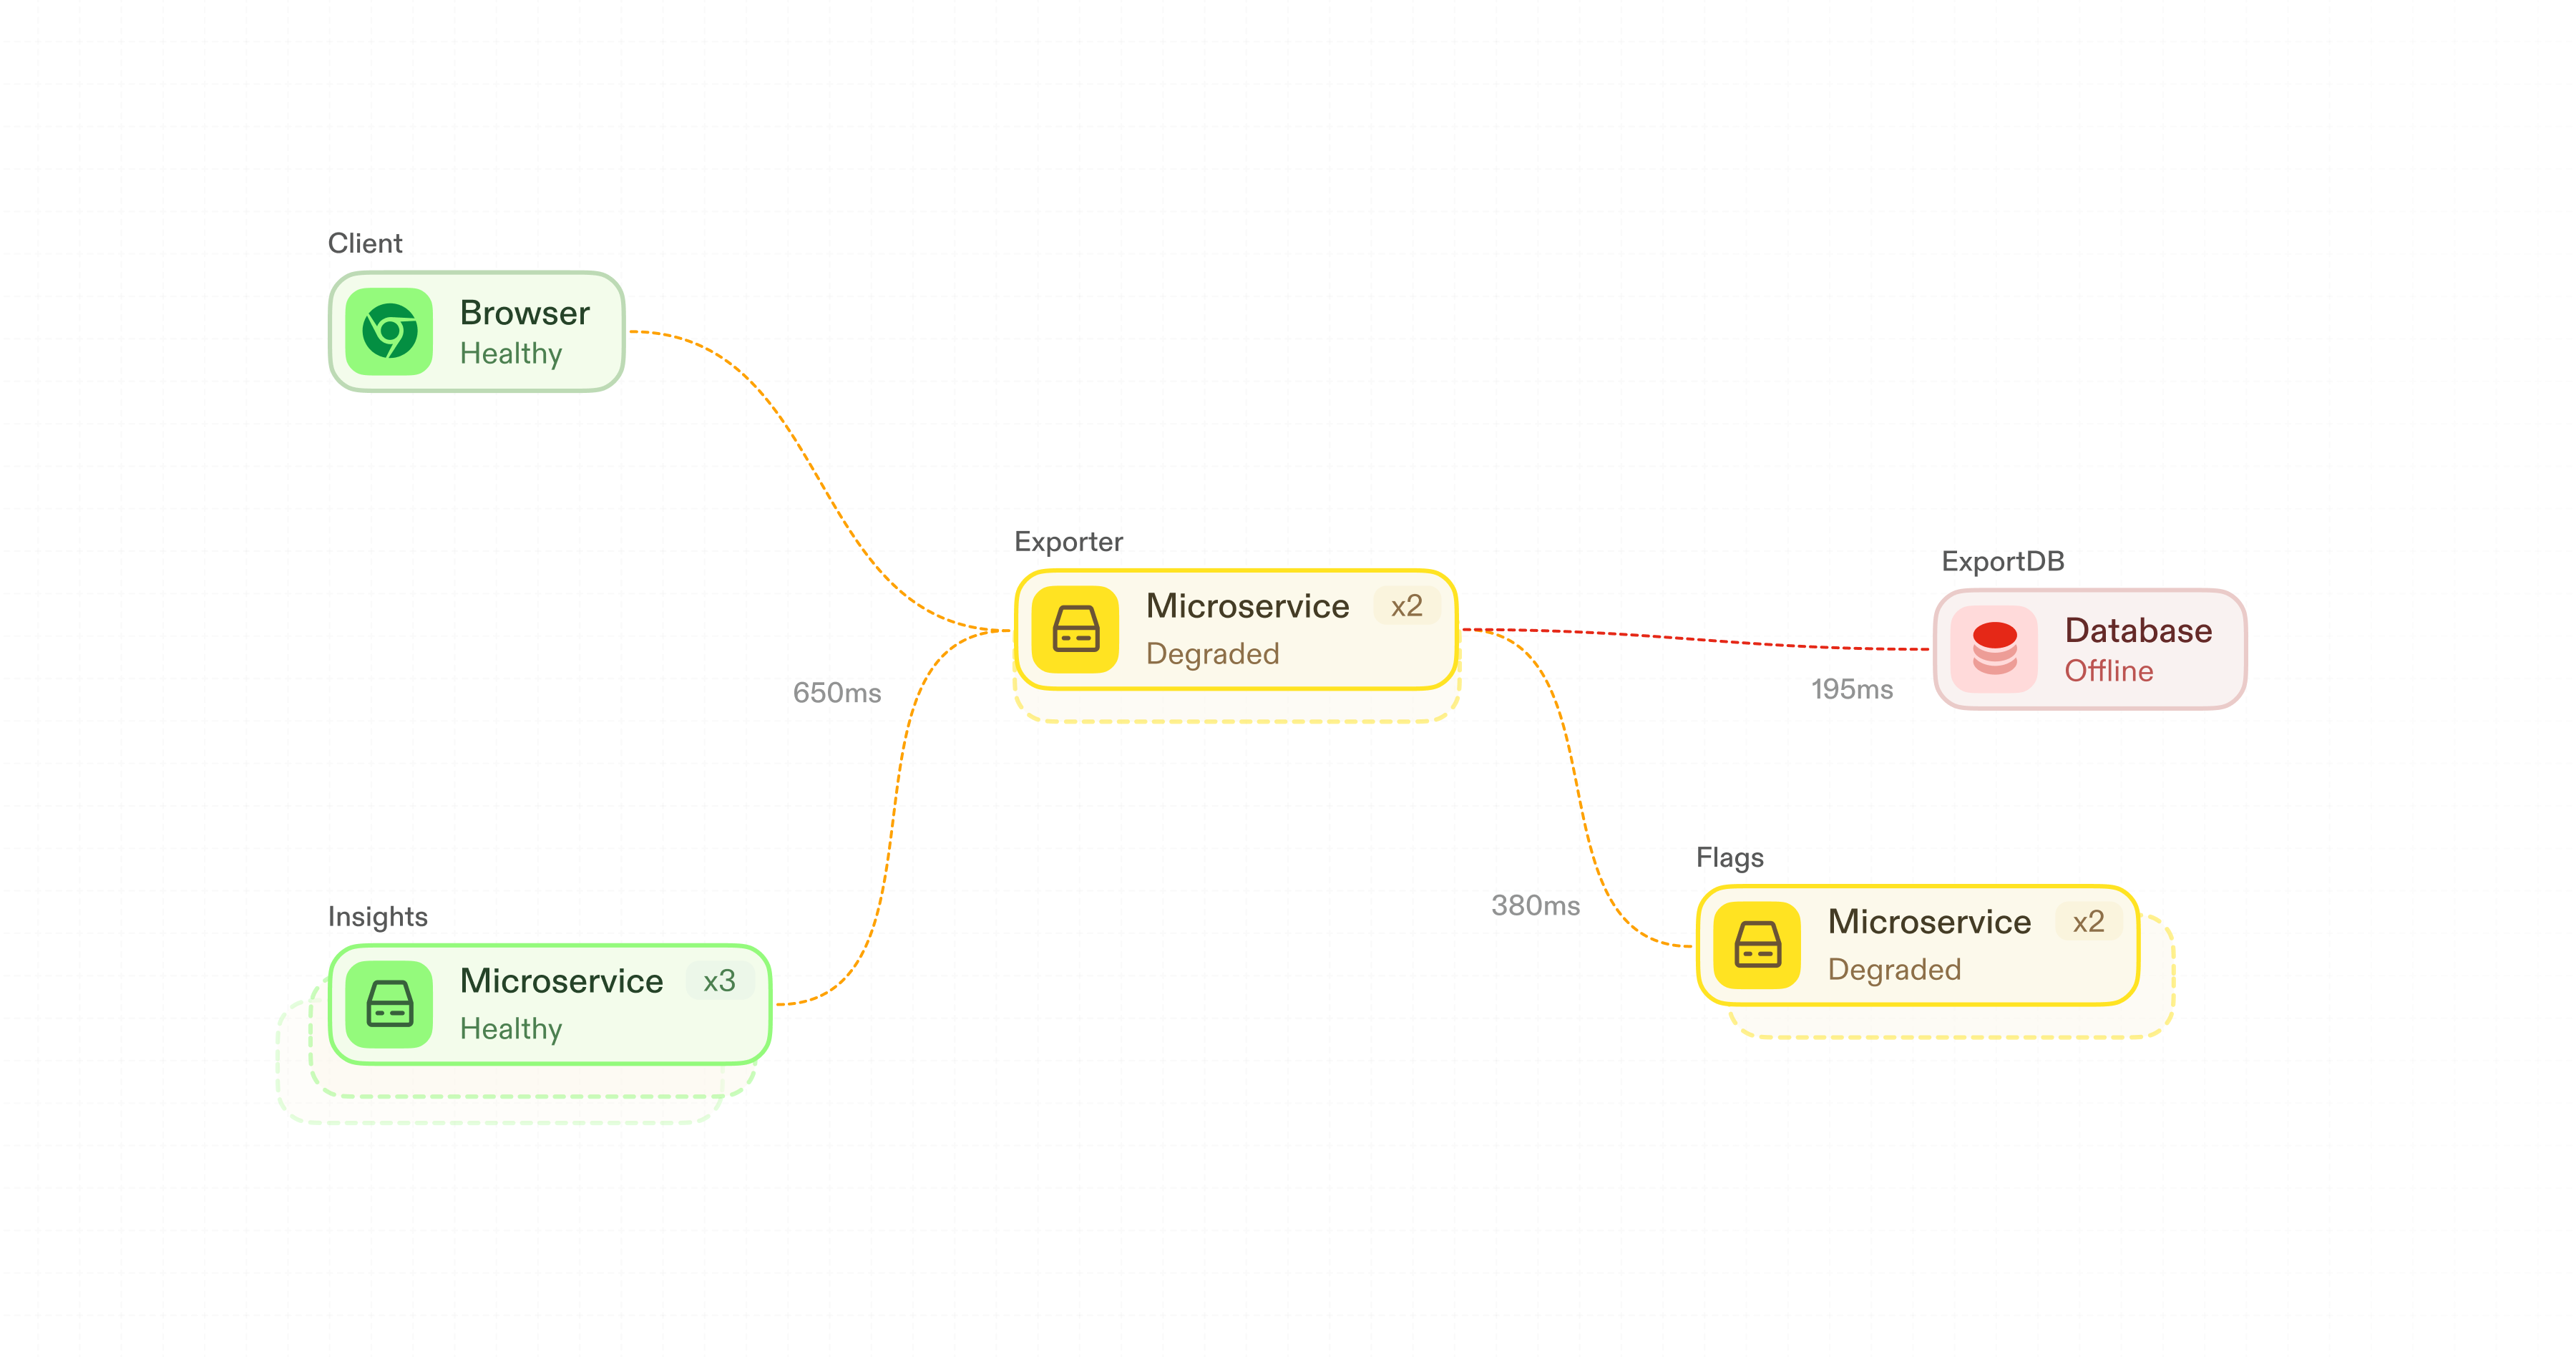
A B2B analytics company lets customers export reports for things like usage data, billing, or compliance snapshots. They run several hundred services across multiple regions. Customers depend on these exports for audits and monthly reporting cycles, and failed exports drive immediate escalations.
One Friday afternoon, an engineer got tagged in a customer support channel flooded with tickets about failed exports. They asked Antimetal, "Why are exports failing?"
At the time the incident began:
- Exporter had been recently deployed
- Flags, a downstream dependency, showed elevated latency
- ExportDB had increased CPU utilization
- Insights, an upstream caller, was retrying requests into Exporter
Antimetal pulled thousands of pieces of data into context, and it confidently concluded the problem was database overload.
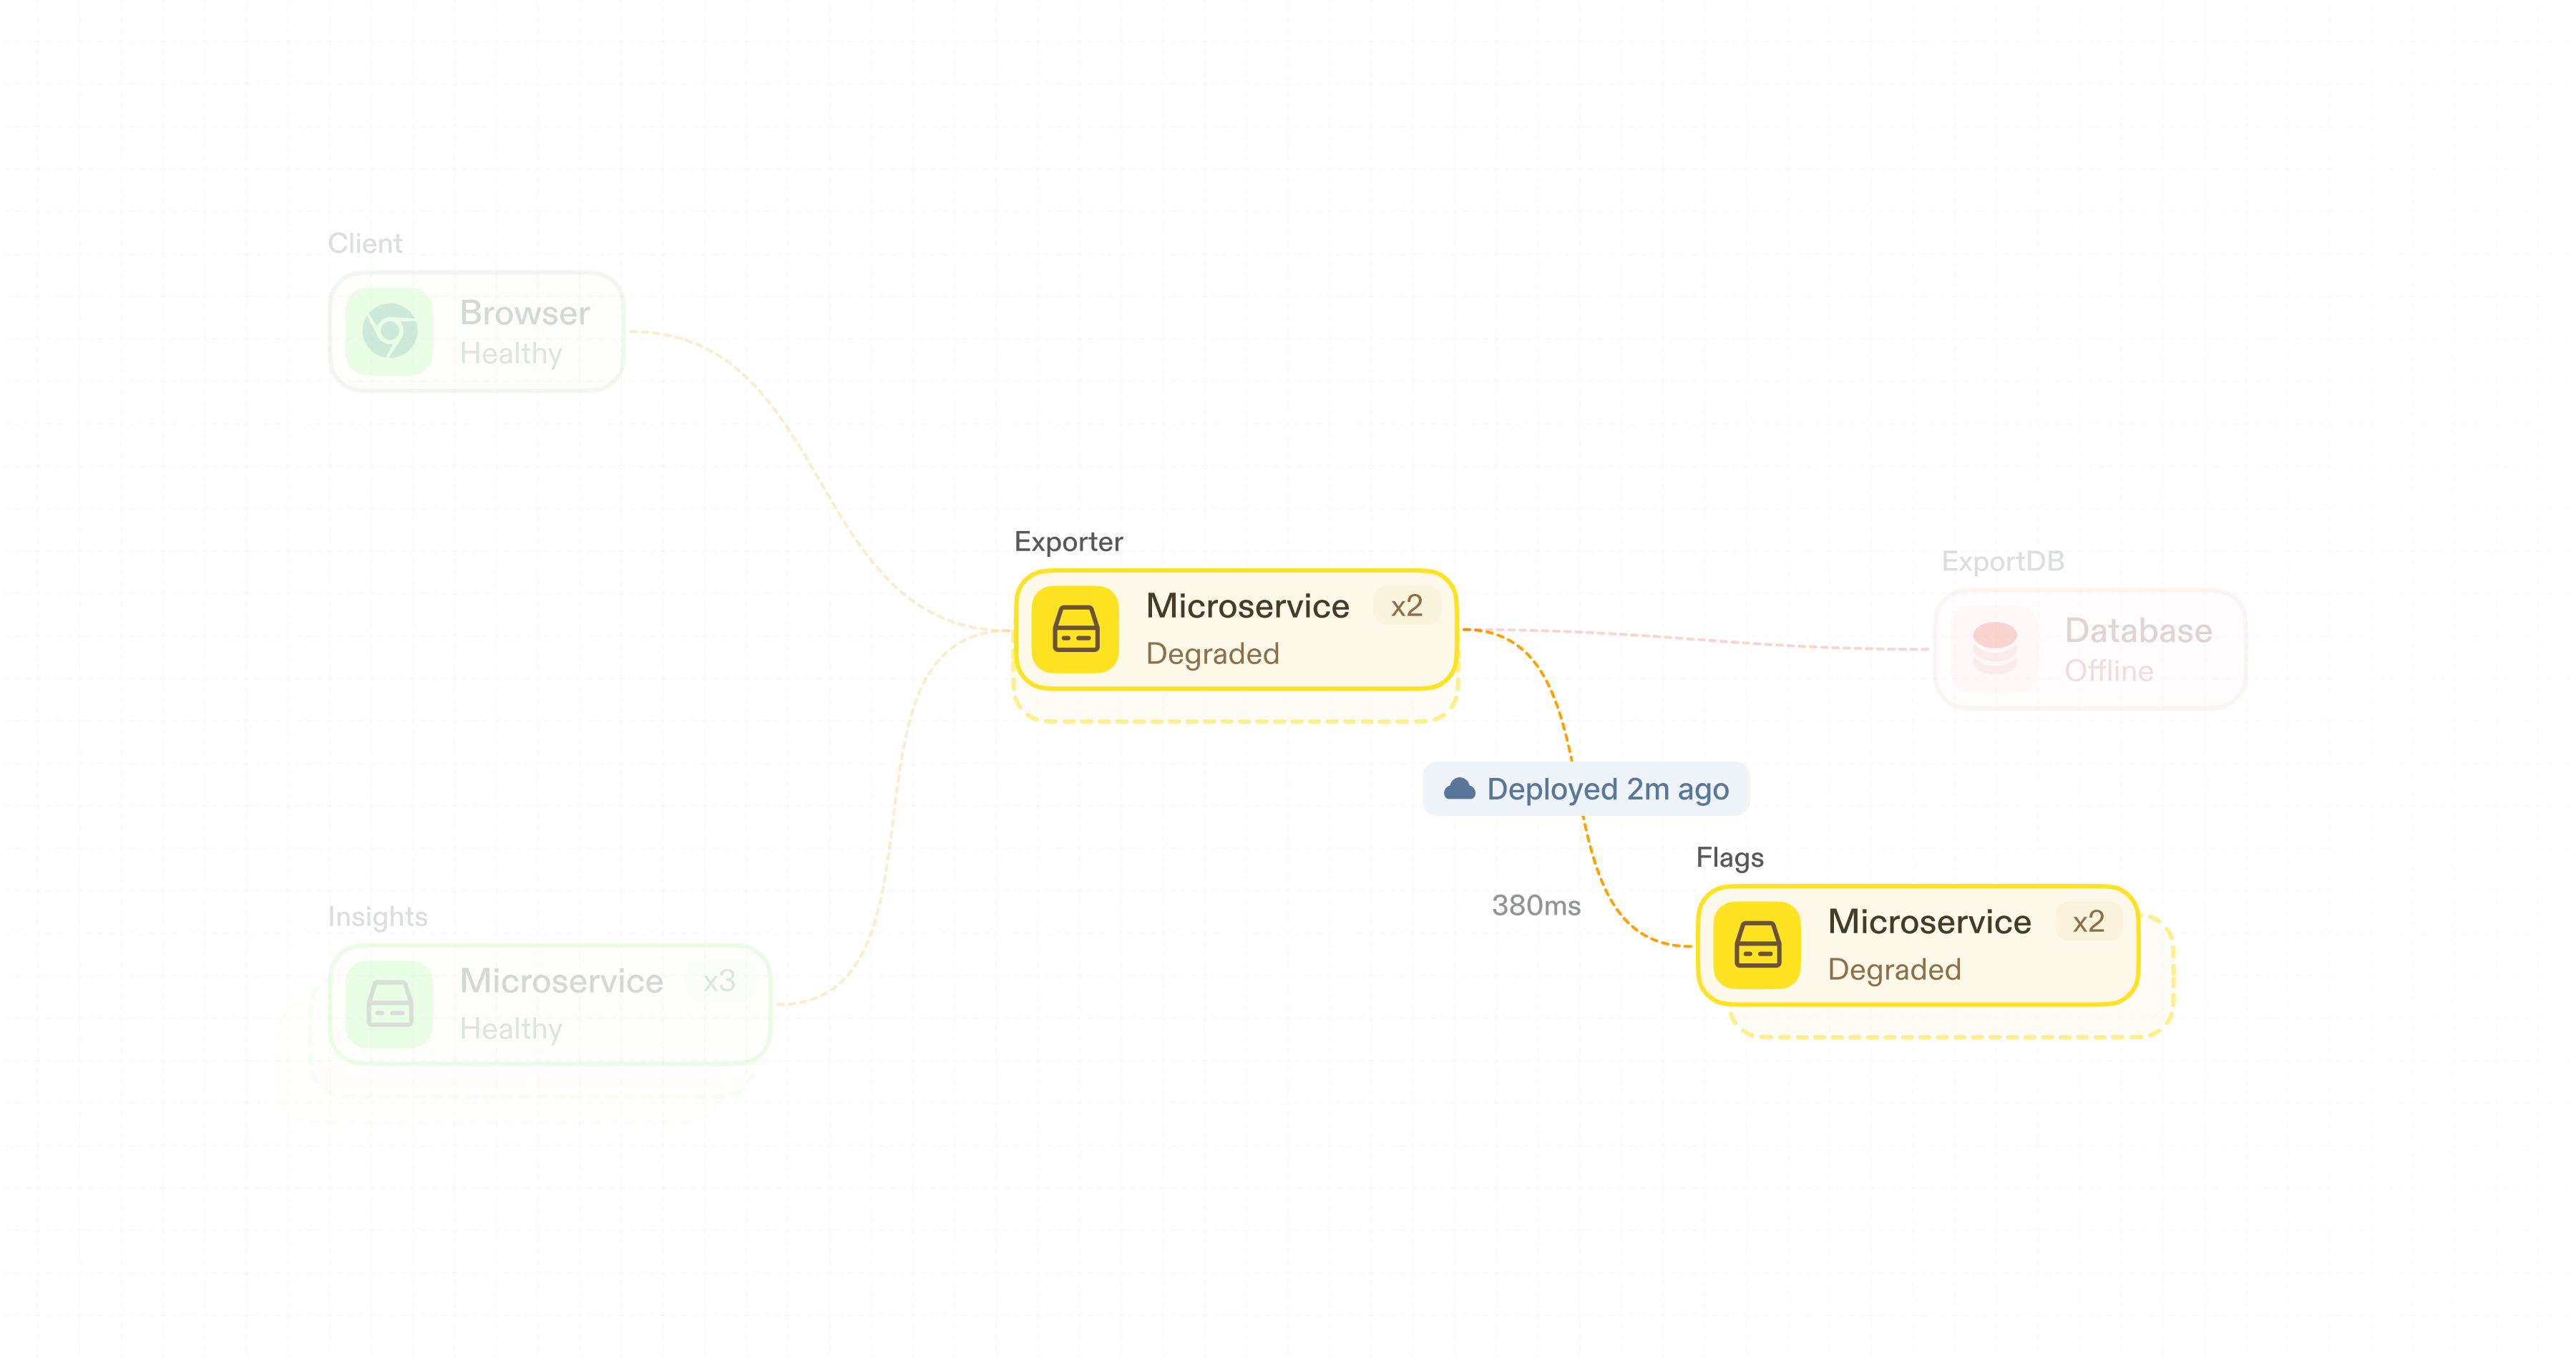
But that was wrong. The deployment introduced a synchronous call from Exporter to Flags. When Flags slowed down under load, Insights timed out and retried, amplifying load until ExportDB degraded. The database was a symptom, not a cause.
An engineer familiar with the system could have solved this, but only by drawing on years of accumulated context. They'd translate "exports failing" to Exporter, treating database degradation as a downstream effect, focus on what changed in the deployment, and use their understanding of how each system behaves to hypothesize what might be going wrong.
This wasn't a technology problem. It was a representation problem.
Antimetal could fetch all the data, but it had no understanding of how those pieces fit together or what they meant to the system as a whole. What was missing was a model—a representation that captured that understanding. So we set out to build one.
The Model
Any representation powerful enough to support machine reasoning over software systems has to answer four distinct questions: what exists, what changed, how failures propagate, and what it means to humans. We call these the structural, temporal, causal, and semantic layers, respectively. Together, they form a single unified model that updates continuously.
Structural
What are the components of the system and how do they interact?
This is the topological map you navigate when something breaks. Without it, every investigation starts from scratch. Building this map requires solving three problems that turn out to be intertwined.
Ontology: Large software systems have thousands of components, and every provider describes them differently, using different schemas and different terminology (e.g. AWS Lambdas and GCP Cloud Functions are functionally equivalent components).
Before we can map anything, we need a common vocabulary. We built an ontology that maps software components from any provider to a shared lexicon, including APIs, services, databases, queues, instances, and repos. This gives us a consistent way to describe any system, regardless of where it runs.
Runtime relationships: Logs and traces reveal which services call each other and the behavior of those interactions, such as what protocols are being used, average payload size, and retry behavior. With this additional data, the agent can reason about multi-hop fault propagation.
The ontology and runtime relationships give us the runtime graph.
Connecting runtime to code: The resources in the runtime graph don't exist in isolation. They're produced and defined by code. Translating observability signals back to code is one of the harder aspects of managing software systems.
We build a representation of each user's codebase by mapping files, functions, and invocations into a call graph. This process leans heavily on well-established techniques in code intelligence. Parsing code into ASTs, resolving functions and call sites, and combining them with imports and dependencies.
But this leaves us with two disconnected representations. A codebase context graph and runtime graph without an obvious link between them.
Logs and traces, which we already use to generate runtime relationships, are that link. Traces are ordered sequences of operations that correspond to traversals through the call graph. Logs work similarly. We templatize log messages and resolve them to their origins points in the codebase, identifying exactly which functions or methods produced them.
The runtime graph tells us where behavior manifests. The code graph tells us why. Together, they construct a coherent representation. When something goes wrong, we can go directly from an observed symptom to the code that is most likely responsible.
Temporal
What changed, and when?
This is the first question any engineer asks when debugging. A static map can't answer that. A snapshot tells you what the system looks like now, not what it looked like ten minutes ago, or what changed in the last hour.
Consider the example above: the connection from Exporter to Flags didn't exist before the deployment. That edge appearing is a key signal. A snapshot from an hour prior would've missed it, and without seeing what changed, the agent would've had no way to reason about the failure.
This means the model must be temporal in two distinct ways.
First, it needs to be always up-to-date. This requires moving from periodic snapshots to a streaming architecture where every update comes in near real time.
Second, it has to support time travel. The ability to rewind to any point in the past, see the system as it was, and diff against the current state. That diff allows us to narrowly constrain the search space and cut through the noise.
Causal
How do failures propagate?
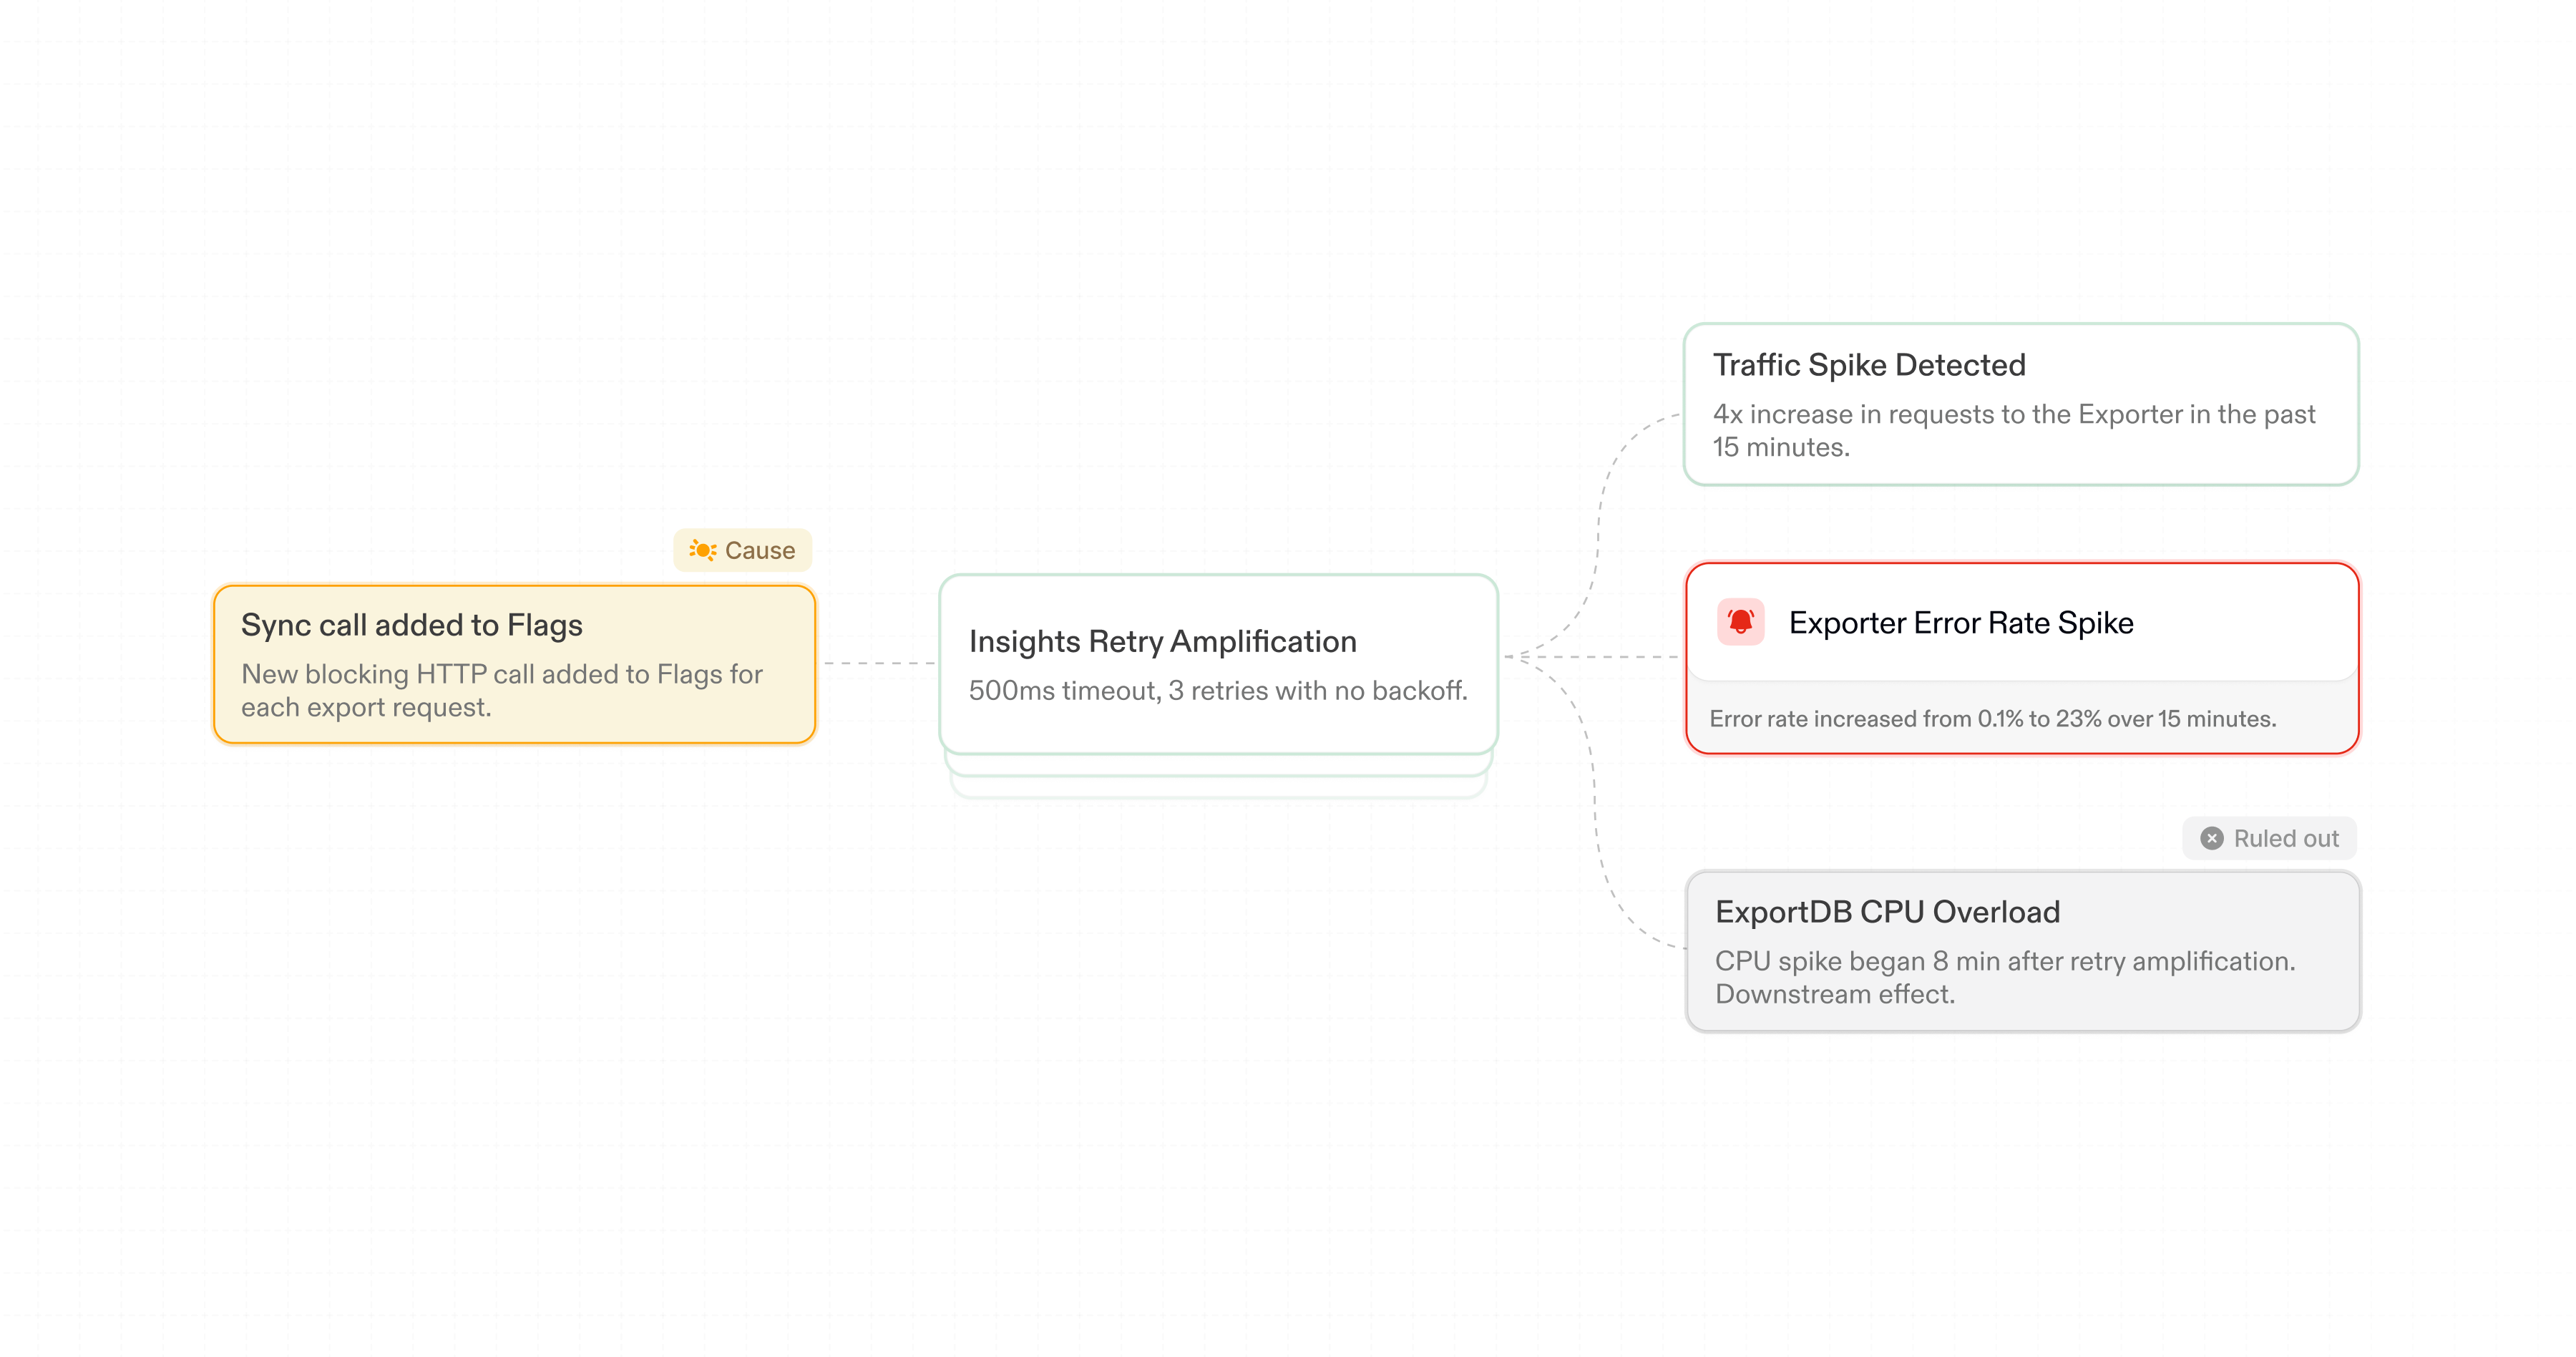
Structural and temporal awareness narrow the search space, but they're not always enough. In a large system, many things change simultaneously. Even with topology and time travel, it's easy to mistake a symptom for a cause.
To distinguish the two, Antimetal needs to understand how faults actually propagate: how memory exhaustion leads to latency, how saturation causes connection errors, how a failure in one service cascades.
This is mechanistic knowledge. Not just that A and B are related, but that A causes B—through what pathway, under what conditions. We encode these relationships as causal graphs: directed acyclic graphs encoding cause-effect relationships. They let us reason backwards from symptoms to probable causes.
Pre-built causal models encode common failure patterns, but real production incidents are out-of-distribution by nature. If they fit a generic template, your alerting already catches them. Real systems have bespoke failure modes that generic models will never capture.
So causality has to be learned from observation. Three sources matter:
System changes: Deployments, config changes, and scaling events are natural experiments. Each change gives Antimetal a counterfactual and a prediction of how effects should propagate: a new synchronous call should increase downstream load, then latency, then timeouts. When they match, we have strong signal that the association is causal.
Postmortems: Postmortems capture how engineers reason about causality in their systems. They typically include the full mechanism: which change introduced the problem, how effects propagated, what amplified them. Antimetal parses these documents and encodes the explanations as candidate causal pathways. The next time similar symptoms appear, those pathways inform the investigation.
Reasoning traces: When Antimetal investigates an incident, it traverses the structural and temporal graph to form hypotheses. It then validates them with evidence and statistical analysis tools, tracing pathways from root cause to symptoms. This produces a chain of inference. When an engineer confirms that reasoning, the trace and its related artifacts become encoded causal knowledge. The next time we see similar symptoms, we have a reusable prior: a pathway that worked before.
These causal graphs get richer the longer we observe. During an incident, Antimetal reasons over them: given these symptoms, what is the most probable root cause? When the pattern is genuinely novel, the agent draws on causal mechanisms learned from prior investigations to generate hypotheses.
Semantic
What does the system mean to humans?
Engineers think in abstractions that exist nowhere in the infrastructure itself. They are often thinking of product, business, or human concerns. The semantic layer bridges that gap.
In the failed exports example, we started with a question: "Why are exports failing?" Antimetal had to map "exports" to our runtime graph. When Antimetal found the root cause, it had to translate the impact: What teams need to be notified? What are customers experiencing? Semantic understanding is what makes both the input and the output legible.
The challenge is that these abstractions differ across every organization. What constitutes "the export system" is specific to your architecture, your team boundaries, and your history. Some of this knowledge is written down—Slack threads, GitHub comments, internal docs, README files—and Antimetal ingests what exists. But documentation is partial and often stale. Most of this context lives in engineers' heads.
So we build this layer by watching engineers work.
Every interaction with Antimetal is a signal. When users search "export issues" and click on the Exporter metrics, that's a mapping. When they debug alongside Antimetal, they reveal how they navigate the system: the services they check, the ones they skip, and the paths they take. We also learn by surfacing uncertainty. When Antimetal isn't sure, it hands the decision to the user. Their next action serves as ground truth to resolve that ambiguity.
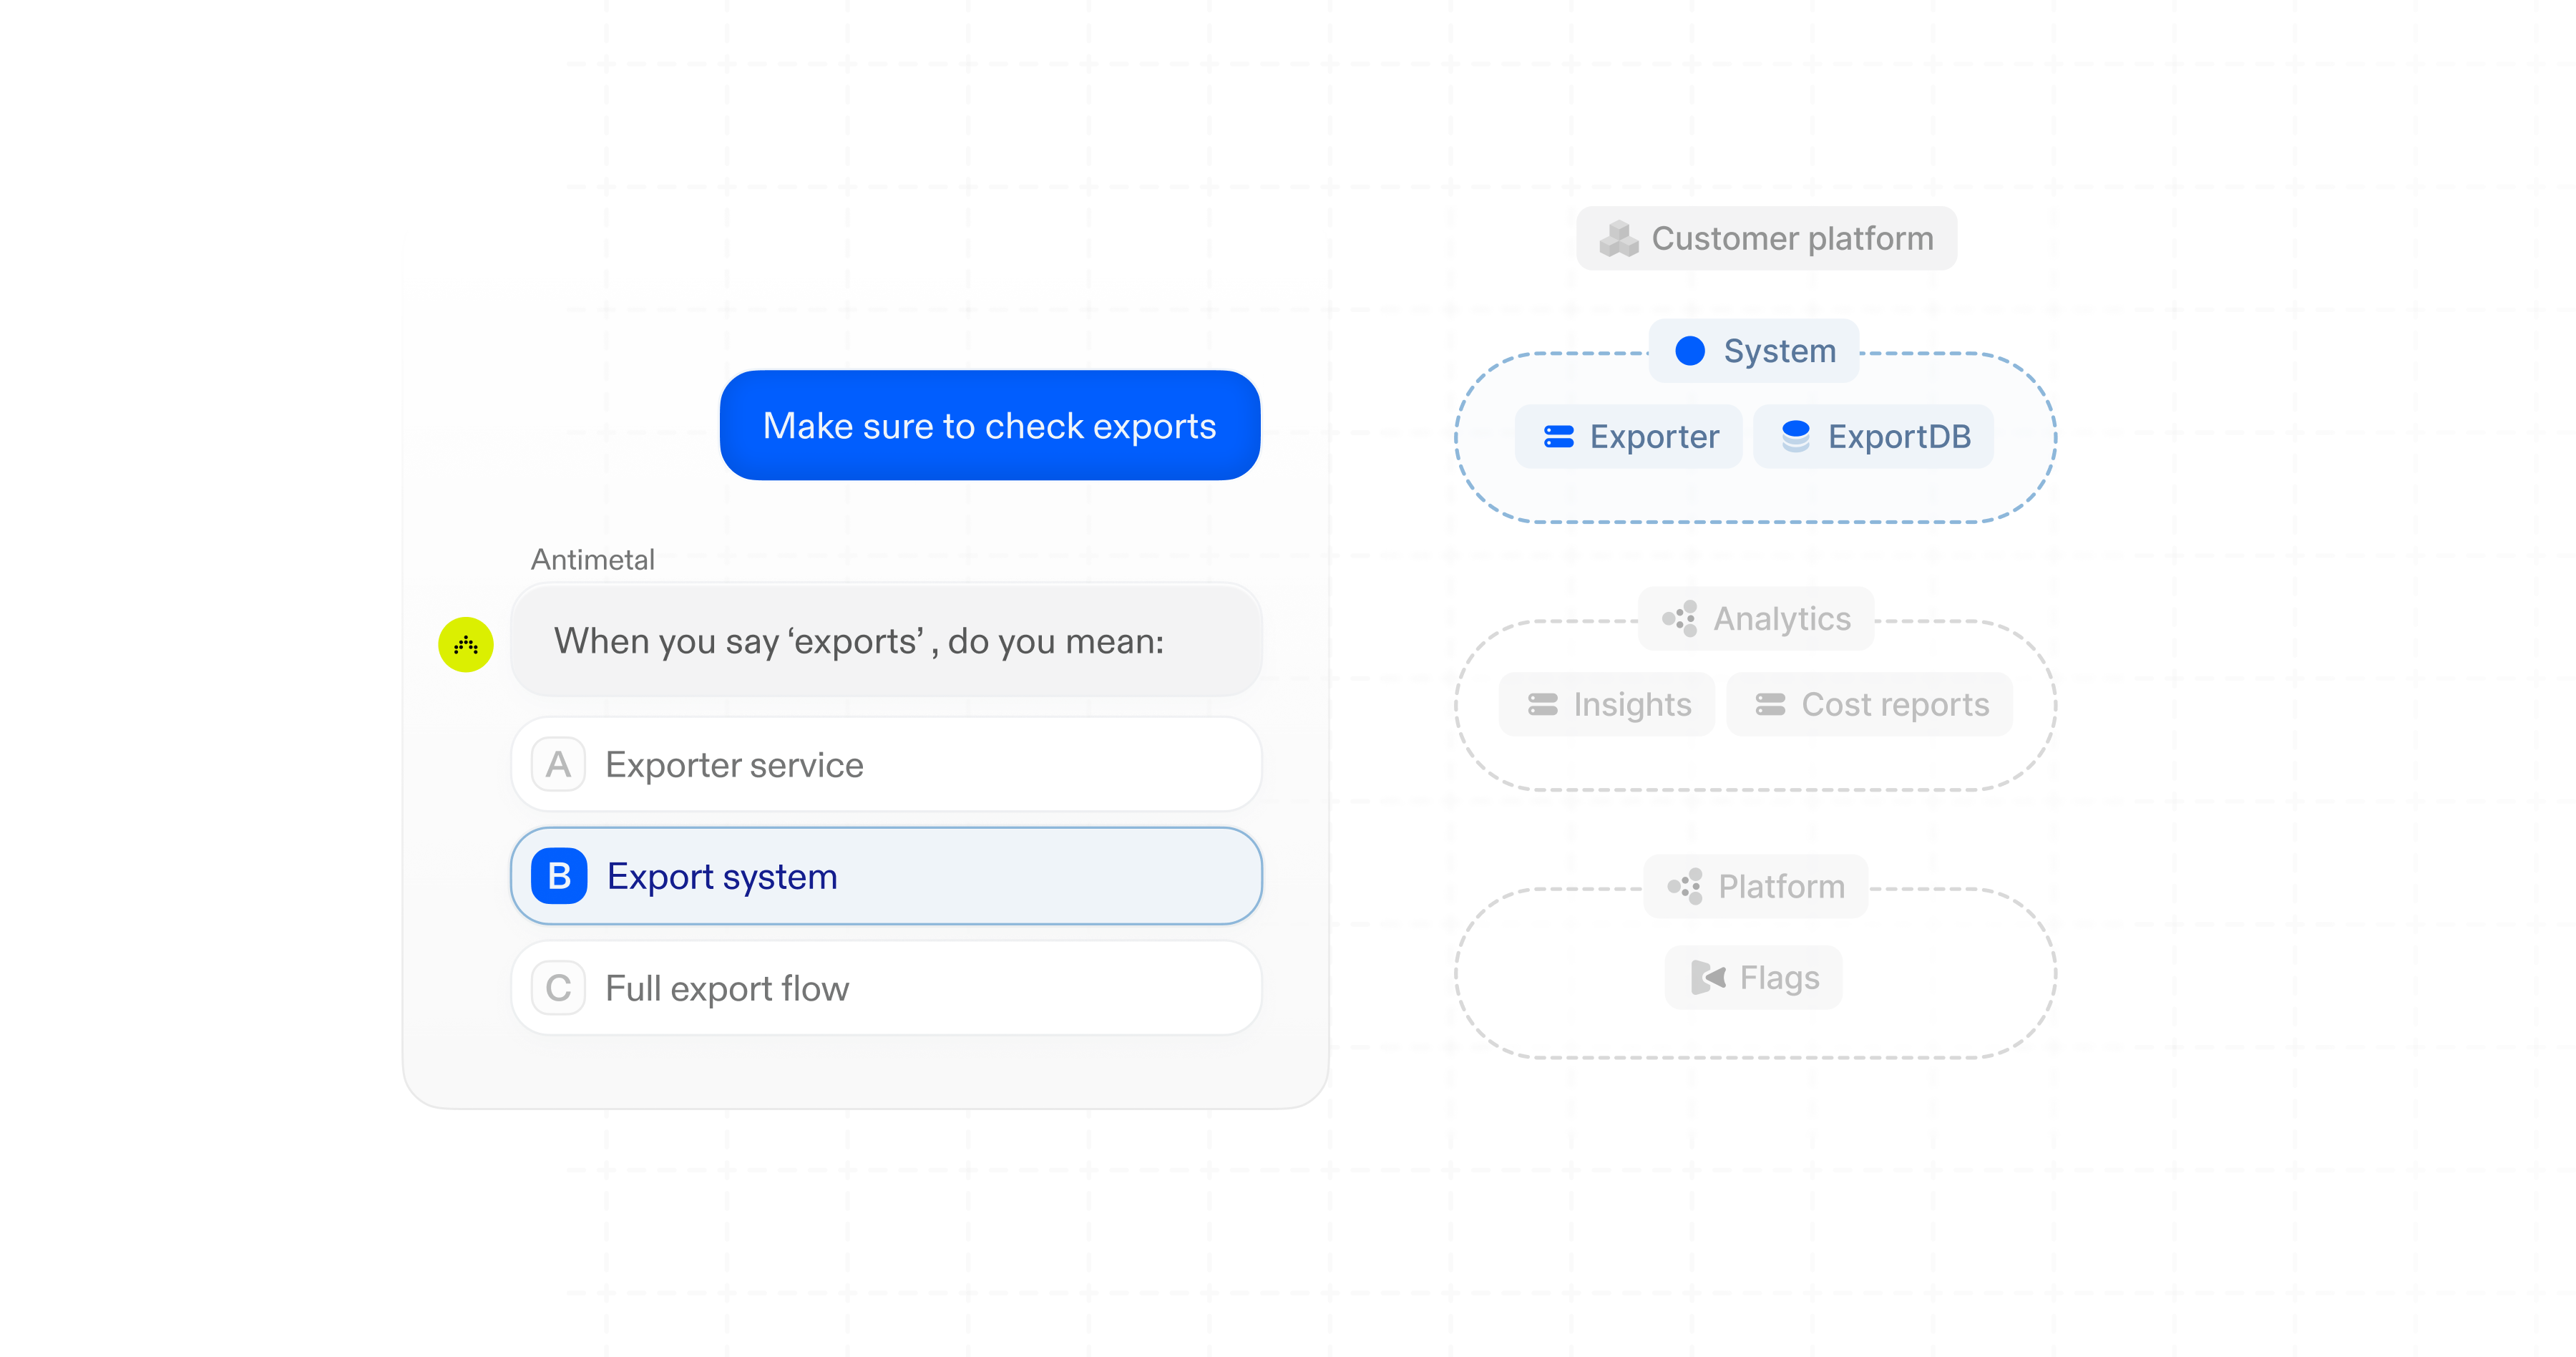
Over time, these signals accumulate into a hierarchy that mirrors how engineers think about the system. Services cluster into systems, and systems cluster into domains. At ten services, every engineer knows what everything does. At a thousand, no one does. Semantic understanding is what makes human abstractions machine-legible.
Putting it Together
None of these ideas are new in isolation. The combination is what's new: a single representation that integrates structural, temporal, causal, and semantic layers and updates continuously. A world model for large software systems.
It's a representation built for machine intelligence. The agent traverses structural relationships, moves backward and forward through time, reasons over causal linkages, and maps the effect back to semantic models humans can understand. Each layer constrains the search space for the next one.
Consider the failed exports incident again.
- Semantic: Antimetal reasons that "failed exports" refers to Exporter and its dependencies
- Structural: The codebase and runtime graphs show that Exporter calls Flags, Insights retries into Exporter, and all three interact with ExportDB
- Temporal: Diffing against the prior state reveals the deployment introduced a new synchronous call from Exporter to Flags
- Causal: Antimetal traces the failure chain backwards, realizing ExportDB degradation is a symptom and the root cause is a new synchronous call to Flags
We get to the answer in minutes, reliably. And because the representation is explicit and unified, it becomes a coordination surface; multiple agents can investigate different regions of the system in parallel, each using the full model, without duplicating work or missing handoffs at the boundaries. This is how we scale to environments with thousands of services emitting trillions of data points per day.
Incidents are just one surface. If you can reason backwards from symptom to cause, you can reason forward from change to effect. If you understand how failures propagate, you can predict where they'll propagate next. If you know what the system looked like at any point in the past, you can ask what it will look like tomorrow.
The hardest problems in infrastructure have never been about missing data. They've been about missing understanding. Closing this gap is the prerequisite to making machine intelligence work in production systems.